
Retention Diagnostic & Sprint
Keep the revenue you already won.
In six weeks we find which customers leave, when and why, and design the first experiments to keep them. Then, if you want it, a one-quarter sprint with a new experiment live every week.
Book a free intro call →How the 3W Loop works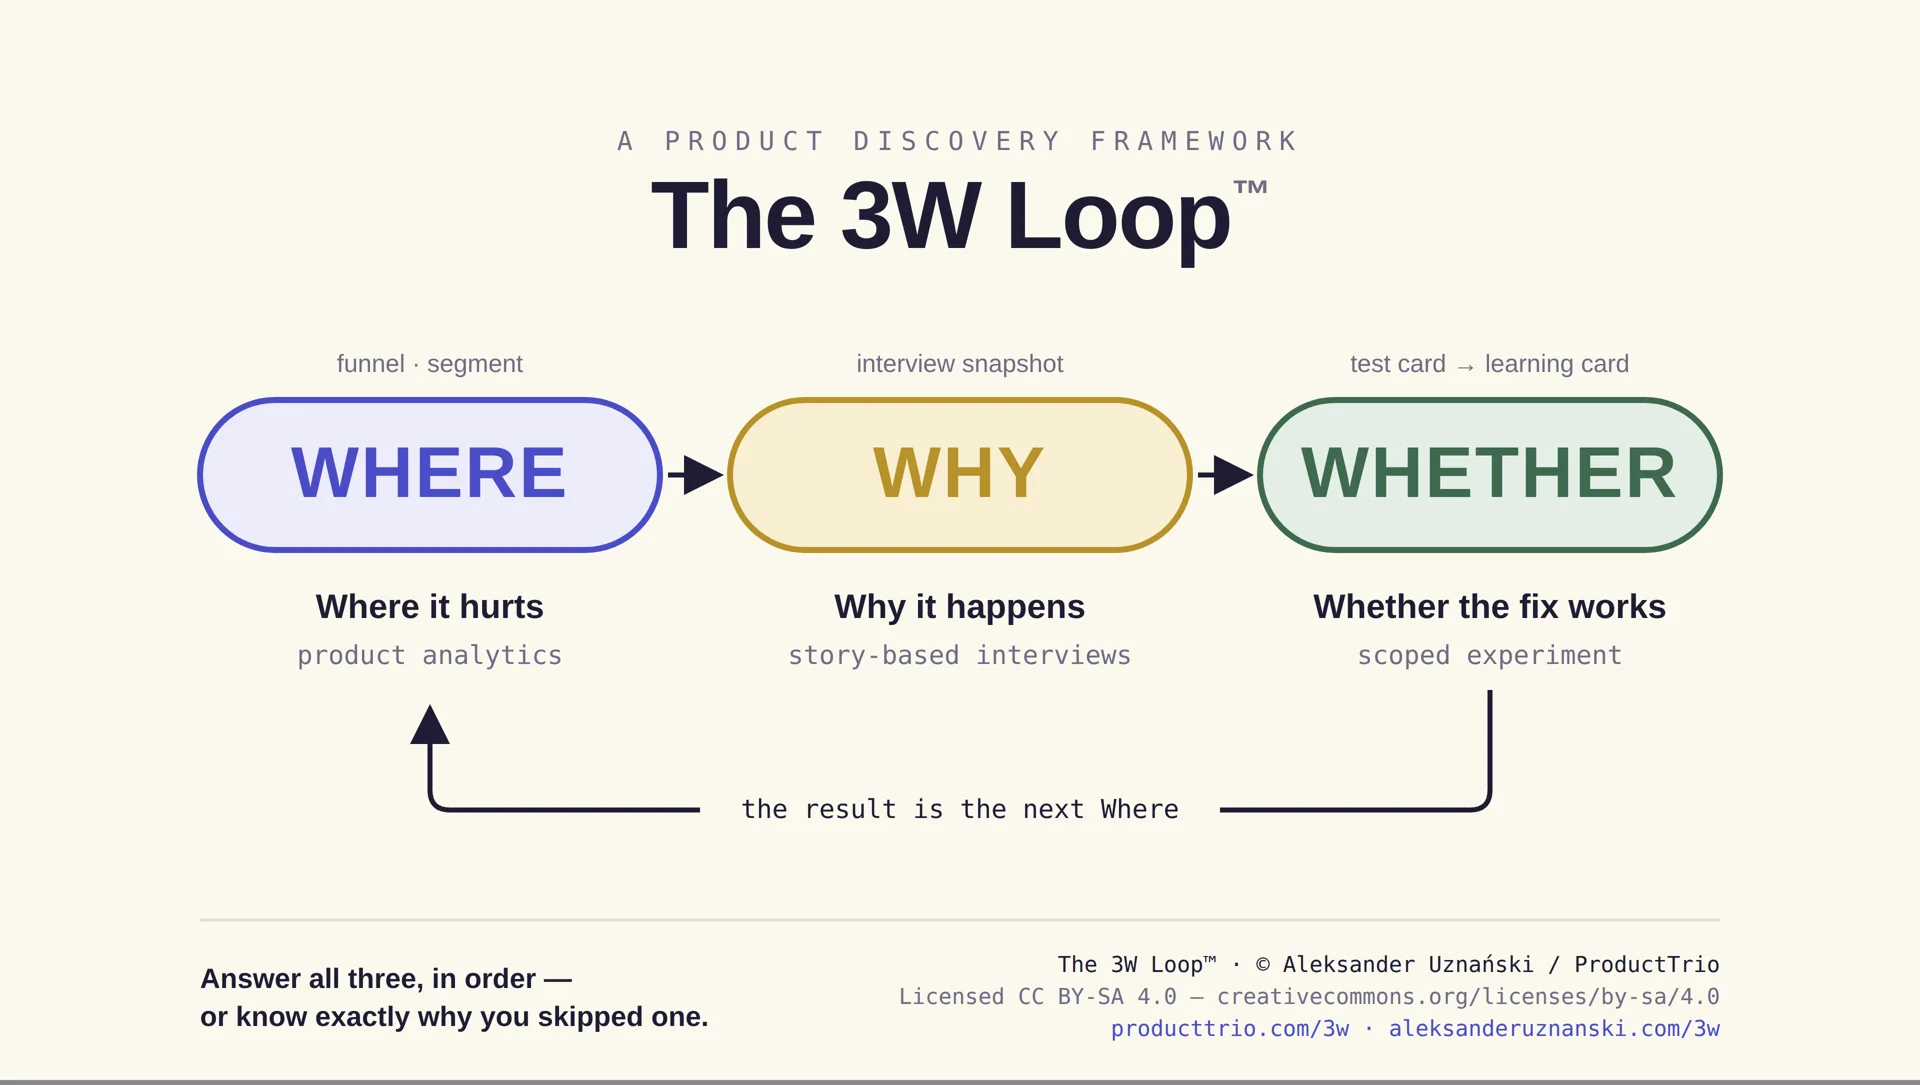
The 3W Loop, run on conversion with product teams at
- Taxfix
- elyps
- UX Pilot
- Deviniti
Churn Costs More Than It Looks
Most growth plans start with winning more customers. Whether that growth adds up depends on how many of them stay.
Where Retention Actually Breaks
Retention is an outcome. It moves when you find the specific cause underneath it, and it does not move when you attack it in general. Three cuts usually find the cause:
Why There Is No Retention Result on This Page
Retention results take longer to read than conversion results: a change that keeps customers shows up in renewals months later, and we have not published a retention result. We would rather show you none than one we cannot back. Here is what we can show:
Common Problems We Diagnose
If retention is your goal, some of these will sound familiar:
How It Works
Where: find who leaves, and when
We start in your product analytics and billing data, not in the backlog. First, the question that decides everything after it: is this a retention problem or an activation problem? Then your cohorts, cut by segment and by start month and read against the benchmark for your kind of business, and the point where the customers who leave stop using the product. You also get a simple model of what each point of retention is worth in revenue.
Why: hear it from the ones who left
Data shows who leaves and when. It cannot show why. Story-based interviews with five to eight customers who canceled, and a few who stayed, walk through the day they decided, what they were trying to get done, and what they switched to. The diagnostic ends with the reasons ranked, the early behavior that best predicts staying in your data, and the first test cards.
Whether: test the fix
Each reason becomes a test card: what we believe, what we will change, which early behavior has to move and by how much, and what must not get worse. Scoped experiments go live through your normal release path with guardrail metrics: the first in week two, then a new one every week.
Learn: keep the loop
A learning card with the numbers: how far the early behavior moved, the retention it predicts, and what that retention is worth in revenue, with the renewal date that will confirm it. What worked, what did not, and why. The next loop, already scoped. And a team that runs the loop without us.
What's Included
- Your retention, read against the right benchmark: six-month user retention and net revenue retention for your kind of business, not someone else's
- Cohorts cut by segment and start month, with the point where the customers who leave stop using the product
- A revenue model of your retention: what each point of it is worth in monthly revenue
- Five to eight interviews with customers who canceled, plus a few who stayed, and a synthesis your team can use
- The reasons customers leave, ranked by how often they came up and how much revenue sits behind the customers who gave them
- The early behavior that best predicts staying in your data, agreed as the number the experiments have to move
- The first test cards, each naming the number it has to move, with success criteria and guardrail metrics
- A readout at weeks three and six for the person who owns the number, in revenue terms
- A new experiment live every week from week two, run with your team in your release path
- Weekly working sessions in the flow of work, not in a separate workshop
- A readout every two weeks for the person who owns the number, in revenue terms
- End of the quarter: a learning card with the numbers, and the next loop already scoped
What We Need From You
A diagnostic only finds something if the setup lets it. Before we start, we agree on five things:
- Access to your product analytics and your billing or subscription data, even if only as an export
- A list of the customers who canceled in the last three months, and a way to reach them. We write the invitations; they go out in your name
- A team that owns the number: product, design and engineering, with time to act on what we find
- For the sprint, room in the release path for a new experiment every week, behind a flag or to a share of customers
- Enough customers leaving each month to learn from. If too few leave for that, we will tell you on the first call, and it is good news
FAQs
Why start with a diagnostic and not with experiments?
Can you measure retention within a quarter?
What if it turns out to be an activation problem?
Do we have to continue to the sprint?
How many churned customers do you need to talk to?
What if churned customers will not talk to us?
Why is there no retention case study on this page?
Does this work for consumer products?
Reading for Retention Teams
Six field notes on the thinking behind this diagnostic:
What good retention actually looks like for B2B products
Around 60% of users active after six months is good for SMB and mid-market SaaS. The benchmarks, and how to use them without chasing the number.
Interview your churned users, not just the ones who stayed
They already decided, so they have no reason to be polite. Three questions to ask about the day they left.
How to improve user activation: find the behavior that predicts a paying customer
Rule out retention, find the early behavior your paying customers share, then test the smallest fix with guardrails.
Iterate on WHO, not what
An average can hide a segment that should never have signed up. How to tell an audience problem from a product problem.
Talk to five customers this week
The cheapest way to de-risk your roadmap costs one hour and zero engineers: talk to five customers.
What is the 3W Loop? Where, Why, Whether
Three questions, asked in order, each with its own instrument. One loop run end to end on a real onboarding problem.
Service Area
Designed for product teams in B2B and consumer products with enough monthly cancellations to learn from. Available remotely (global) and on-site across Europe. Aleksander is based in Wrocław, Poland.
Losing people before they ever pay? That is a conversion problem, and it has its own page: the Funnel Conversion Sprint.